Generating the Time Series Data Chart
The time series data stored in TSDB can be filtered by parameters and displayed graphically for the quick viewing and analysis of data.
This section shows how to configure times series data filtering conditions, generate data charts, and quickly view and analyze data.
Before You Start
- Ensure that the storage policies have been configured for device measurement points, and the measurement point data is of numeric type.
- Ensure that data has been ingested from devices and stored in TSDB.
- Ensure that you have logged in:
- EnOS Cloud: Log in to the EnOS Management Console, and select Time Series Data Management > Data Insights. Supports Fomatted Data and Unfomatted Data data insights.
- EnOS Edge: Log in to the local operation and maintain tool of EnOS Edge,and select Data Insights.
Start Formatted Data Data Insights
- In the Select Time Range section, select or specify the time range for querying data.
- 1H: From 1 hour ago to the current moment
- 1D: From 00:00 of the current day to the current moment
- 7D (EnOS Cloud only): From 00:00 7 days ago to the current moment
- Customized: Specify the time range
- Click the Select Devices input box, and select one or more devices from the drop-down list. The selected devices will be dynamically shown in the Selected Measuring Points column. To reselect devices and clear the list, click Reset.
- In the Select Data Type section, select the type of data you want to view. After selecting different data types, the Selected Measuring Points column will dynamically display the corresponding measurement point list.
- If you select ALL, the Selected Measuring Points column will display all the measurement points of the selected device accordingly. In addition, when querying data, aggregation processing or state change query will not be performed on the measurement point data.
- If you select the AI or PI type, you need to also select a data aggregation algorithm and aggregation interval for data querying. The currently supported aggregators are as follows.
- count: Takes the number of data points in each time range as the result.
- sum: Takes the sum of the measurement point values in each time range as the result.
- avg: Takes the average of the measurement point values in each time range as the result.
- max: Takes the maximum value of the measurement point values in each time range as the result.
- min: Takes the minimum value of the measurement point values in each time range as the result.
- first: Takes the first measurement point value in each time range as the result.
- last: Takes the last measurement point value in each time range as the result.
- If you select the DI type, you need to also select whether to perform state change query for the device status data.
- In the Selected Measuring Points column, click on the selected device name, expand the list of measurement points, and select one or more measurement points to be queried.
Start Unformatted Data Data Insights
Note
EnOS Cloud only
- In the Select Time Range section, select or specify the time range for querying data.
- 1H: From 1 hour ago to the current moment
- 1D: From 00:00 of the current day to the current moment
- 7D (EnOS Cloud only): From 00:00 7 days ago to the current moment
- Customized: Specify the time range
- Click the Select Devices input box, and select one or more devices from the drop-down list.
- In the Select Data Type section, tick Unformatted data.
- Enter the Data Identifier and click Search. The queried measurement point data will be displayed in the chart on the right.
Results
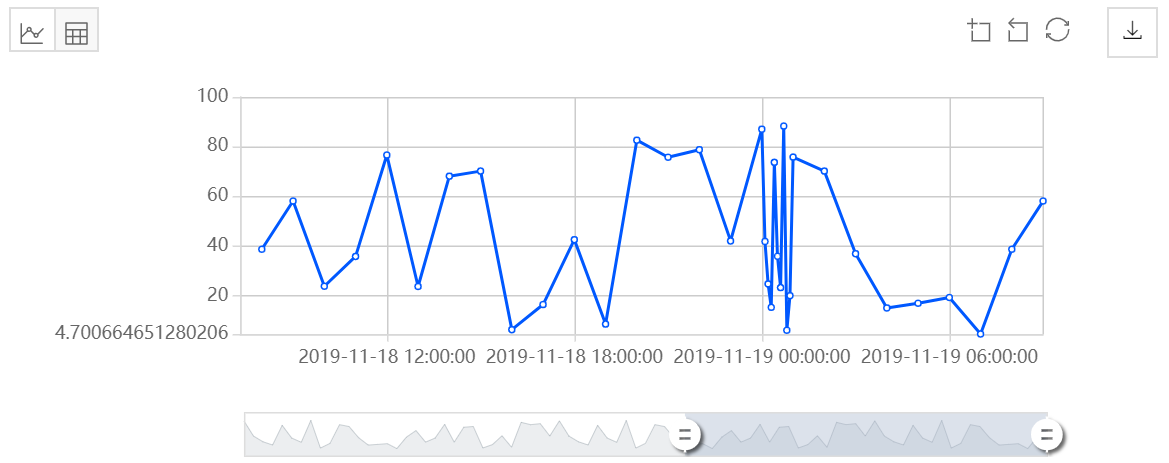
The queried measurement point data is displayed in the chart on the right. Drag the time line under the chart or use the area zooming tool in the upper right corner of the chart to view detailed information of a specific time range in the chart, including the data timestamp, point name, data value, and data curves.
Note
- When the data is formatted data, for a single measurement point of a single device, the chart can display at most 5,000 data records.
- When the data is unformatted data, the chart can display at most 5,000 data records. To query more, use the corresponding TSDB storage service API.
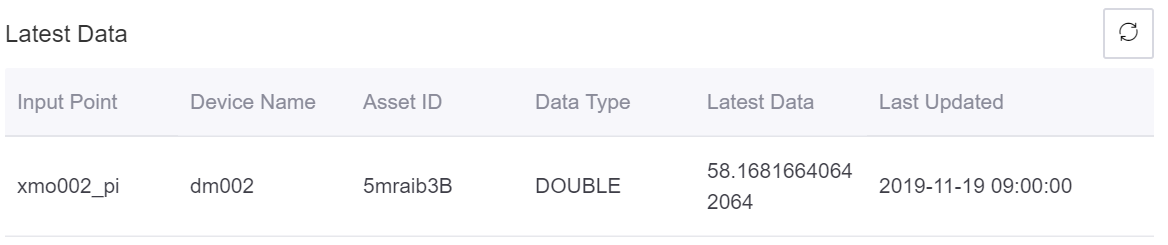
Under the data chart, you can view the latest data of the selected measurement points and the last updated time of the data.
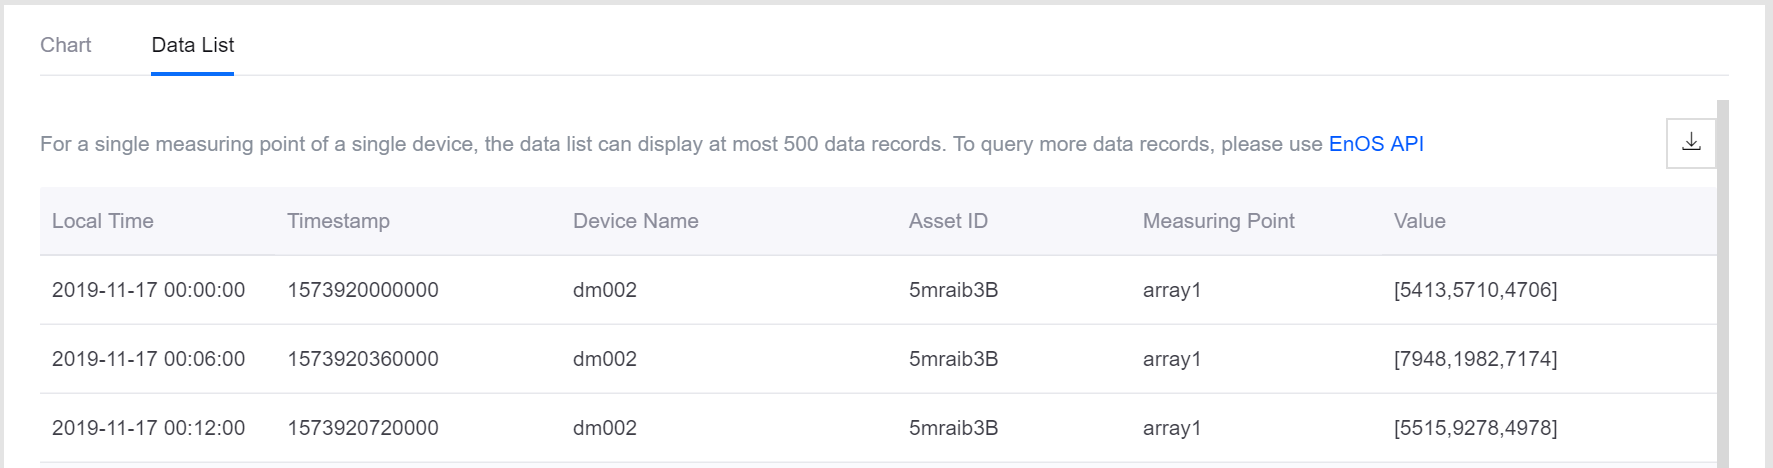
Click Data List to view the information of the queried data.
Note
- Only formatted data can be viewed in list form.
- For a single measurement point of a single device, the data list can display at most 500 data records. To query more data records, use the corresponding TSDB storage service API.
Next Steps
View the Data
To view the data of other devices or measurement points, select the corresponding device name, data type, and measurement point name to query again.
Download the Data
After viewing the queried measurement point data, you can click the Download Data icon ![]() to download the queried data. Downloaded data will be saved as
to download the queried data. Downloaded data will be saved as data_insight_{current_date}.csv.