About Digital Twin Visualization
If enterprises develop their own visualization applications, high development cost and a long cycle of application delivery are often required. In addition, business scenarios change rapidly. Different users and roles have different needs on the customization of visualization pages, and the scalability of their applications is relatively low.
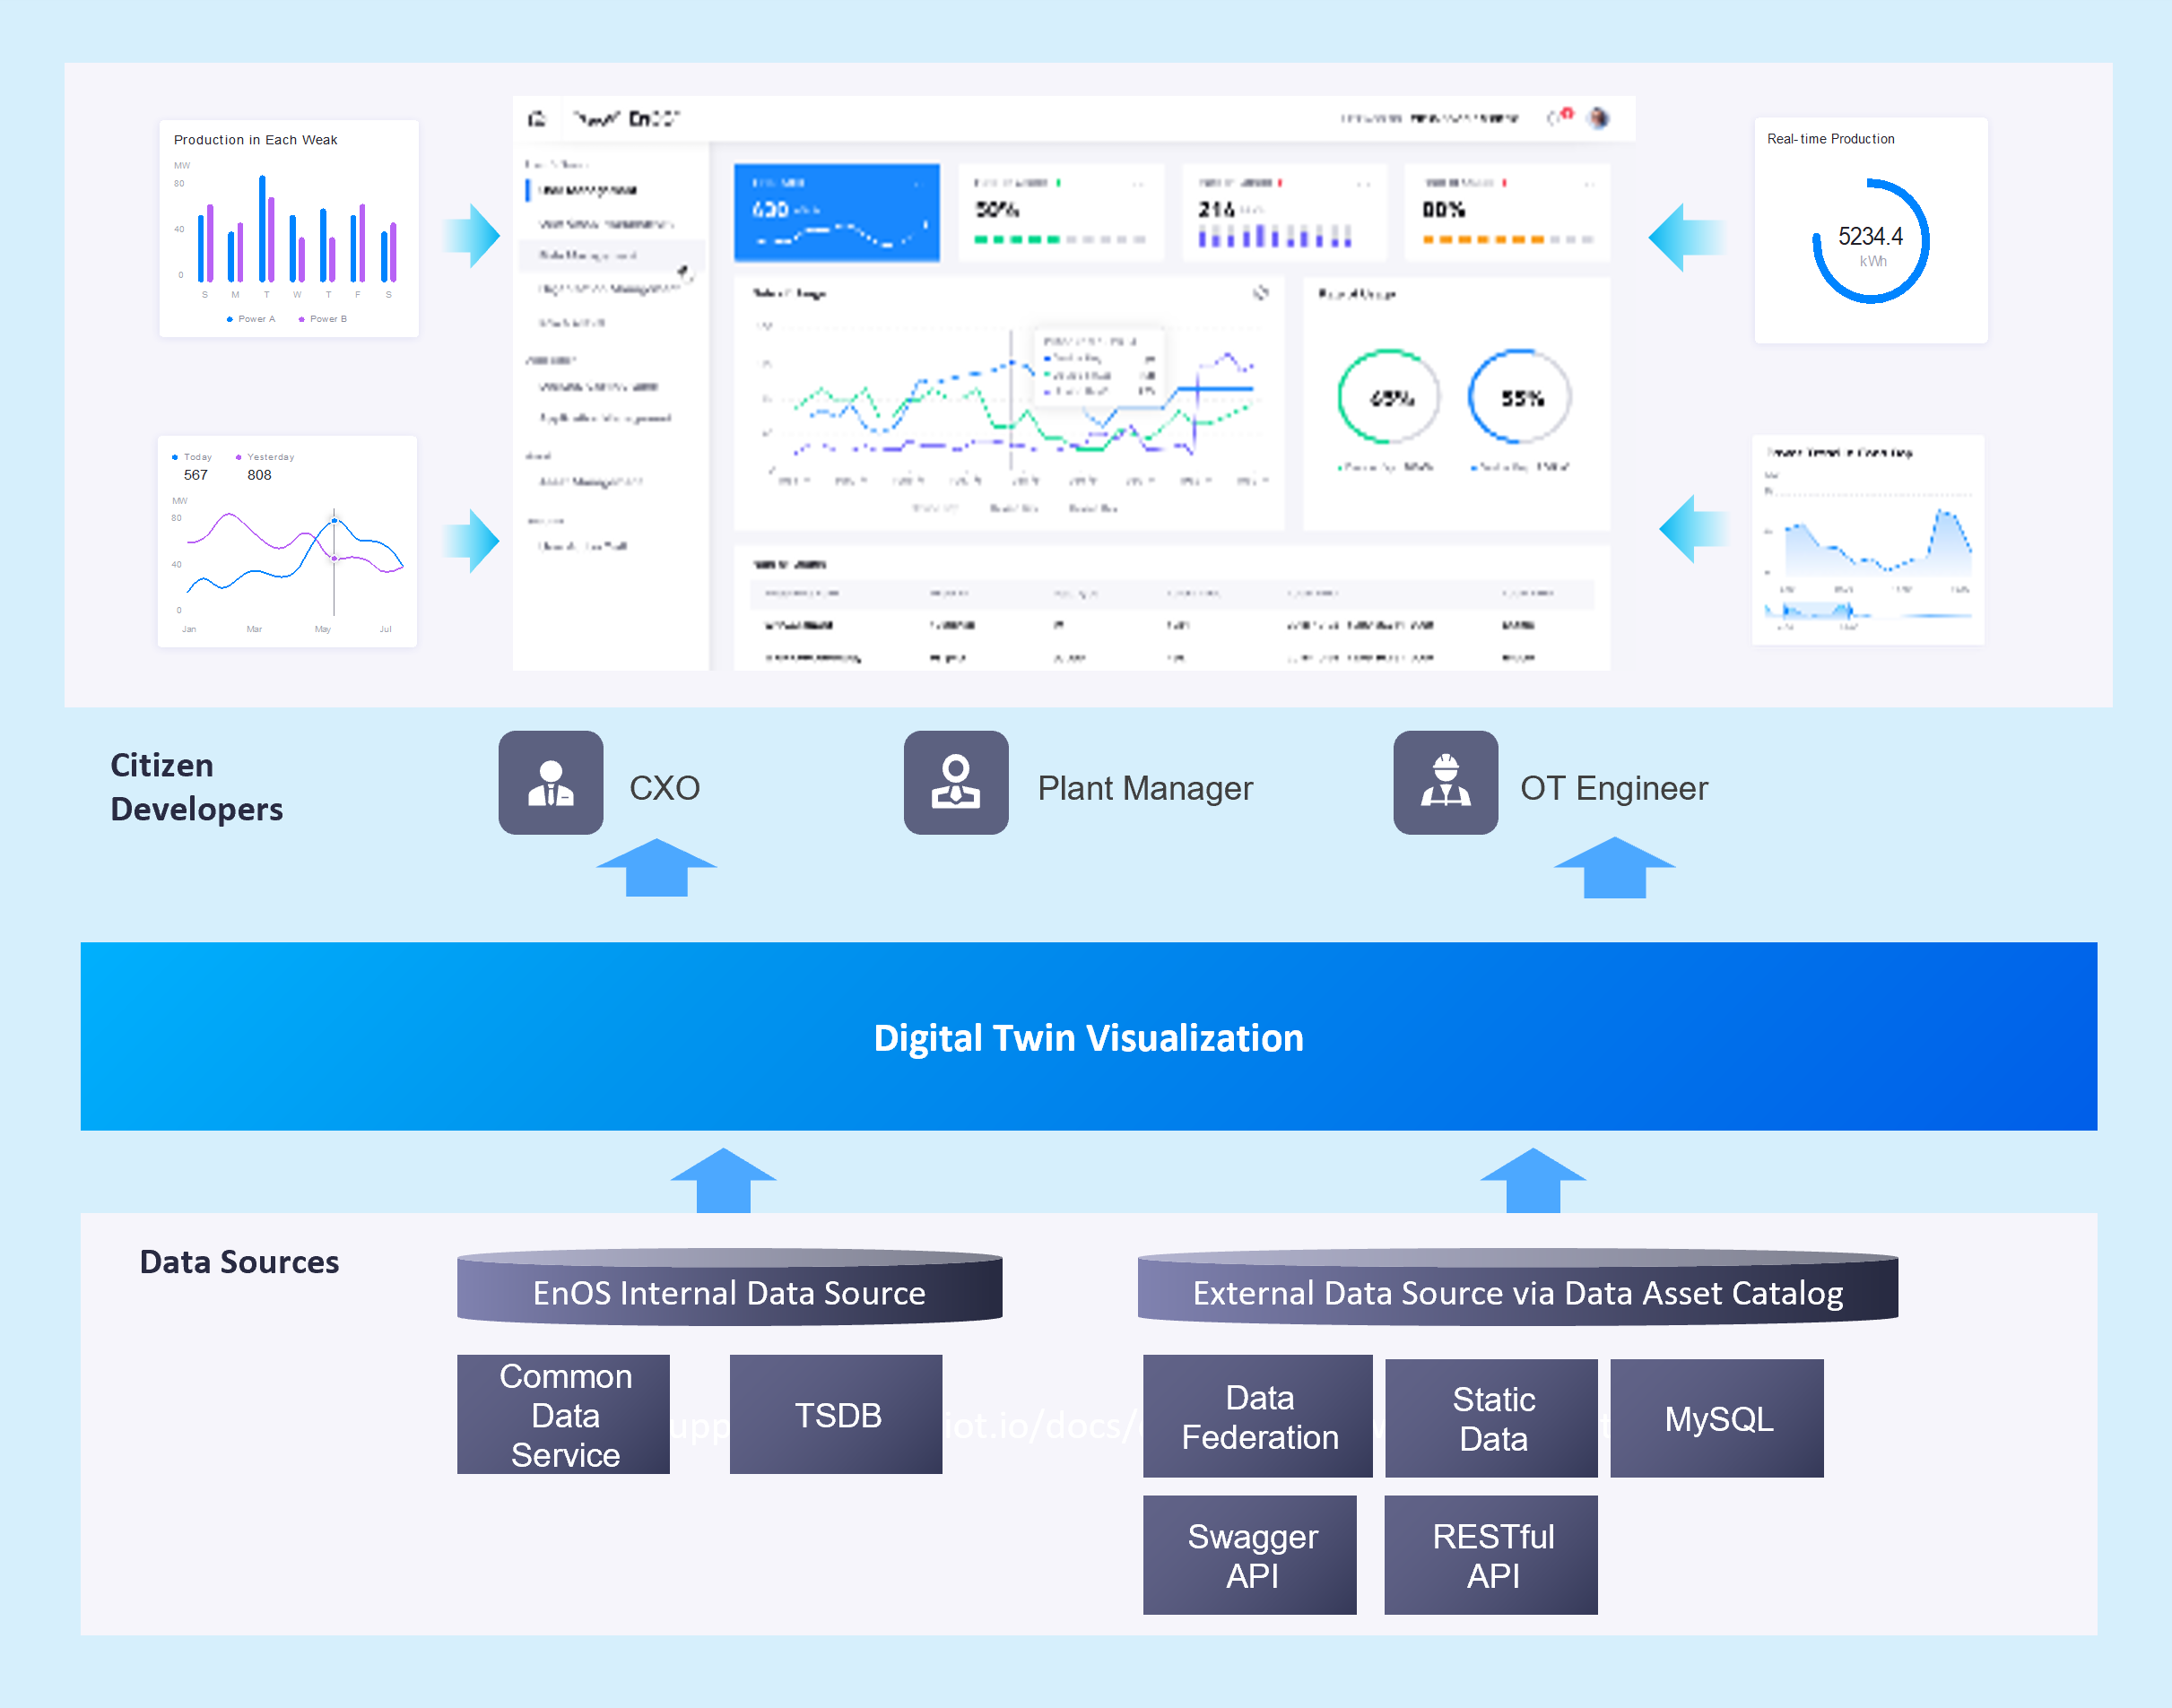
The EnOS™ Digital Twin Visualization (DTV) service provides enterprises with data visualization solutions. It is integrated with EnOS Application Portal to help domain experts and developers achieve the visualization of the data from digital twin modeling through low-code/no-code drag-and-drop experience. This helps to improve the development efficiency of visualization applications and enhances the reuse of applications in different domains.
Main Features
DTV consists of these modules:
- Page Editor: Supports dragging and arranging chart widgets on the canvas.
- Chart Editor: Click a chart on the dashboard editor to enter the chart editor, which is divided into two parts:
- Data Editing: Combine the data in the data source according to three categories, i.e. dimensions, comparisons and measurements.
- Chart Editing: Select the combination of dimensions, comparisons and measurements selected in the data editing to fit the matching chart
- Data Source Management: Import external data to DTV for data viewing, adding, modifying and deleting
- Dataset Management: Supports previewing and preprocessing of datasets
- Widget Library: Provides a rich library of built-in widgets for easy building of visualization pages
- Permission Management Workbench: The authorization of configuration projects (for platform users and application service accounts) can be managed under the IAM management module in the EnOS Console
- Three-Party Integration SDK: SDK used for integrating configuration pages in three-party applications
Capabilities & Benefits
1. Simple Drag-and-drop Experience on Building Data Visualization Pages
Without coding, business experts or developers can quickly build indicator analysis and monitoring visualization pages by dragging and dropping widgets.
- Drag-and-drop adjustment of layout: The widget size is customizable and can adapt to the screen size of different devices.
- Configurable widget style: You can select different widget types and configure their styles according to different needs.
- Direct editing and adjustment allowed in the application: With the DTV SDK, application users can directly modify the page layout and data configuration in the application.
2. Plug-and-play Data Binding and Processing
The EnOS DTV provides a unified outlet for the data from multiple sources as well as flexible data processing capabilities, enabling rapid data acquisition, aggregation and analysis.
- Binding of multi-source and cross-domain asset data: It supports importing and synchronizing multiple types of data sources. After the asset data sources are bound, business personnel can more directly and conveniently configure the business data corresponding to the visualization widgets.
- Asset data aggregation processing: Basic data aggregation processing capabilities are available, including sum, average, maximum, minimum and other calculations.
- Custom data fields: It supports processing custom data fields through low-code scripts.
3. Domain Knowledge Template Accumulation
With the domain accumulated built-in widgets and templates, developers can reuse templates to quickly build data visualization pages. In addition, users can further accumulate and share highly reusable widgets and templates, improving their development efficiency.
- Widget template: It allows to save the configurations of a single widget. Through the widget template, users can save the configurations on widget data binding and style, and accumulate their insights of business data and their experience on business data visualization.
- Dashboard template: It allows to save the configurations of a single dashboard. Users can integrate their insights of business into a dashboard template through the combination of multiple widgets as well as interactive operations such as configuring filters or widget link for widgets.