Monitoring Task Nodes
You can perform the following monitoring actions for a task node.
- View details of a task node, including attribute and node content.
- Monitor running instances and view the resource usage (CPU and memory) of a task node.
- Set the resource configuration of a task node.
Viewing Details of the Task Node
Take the following steps to view details of the task node.
In the EnOS Management Console and click Workflow Operation > Task Nodes. A table of all task nodes will be displayed.
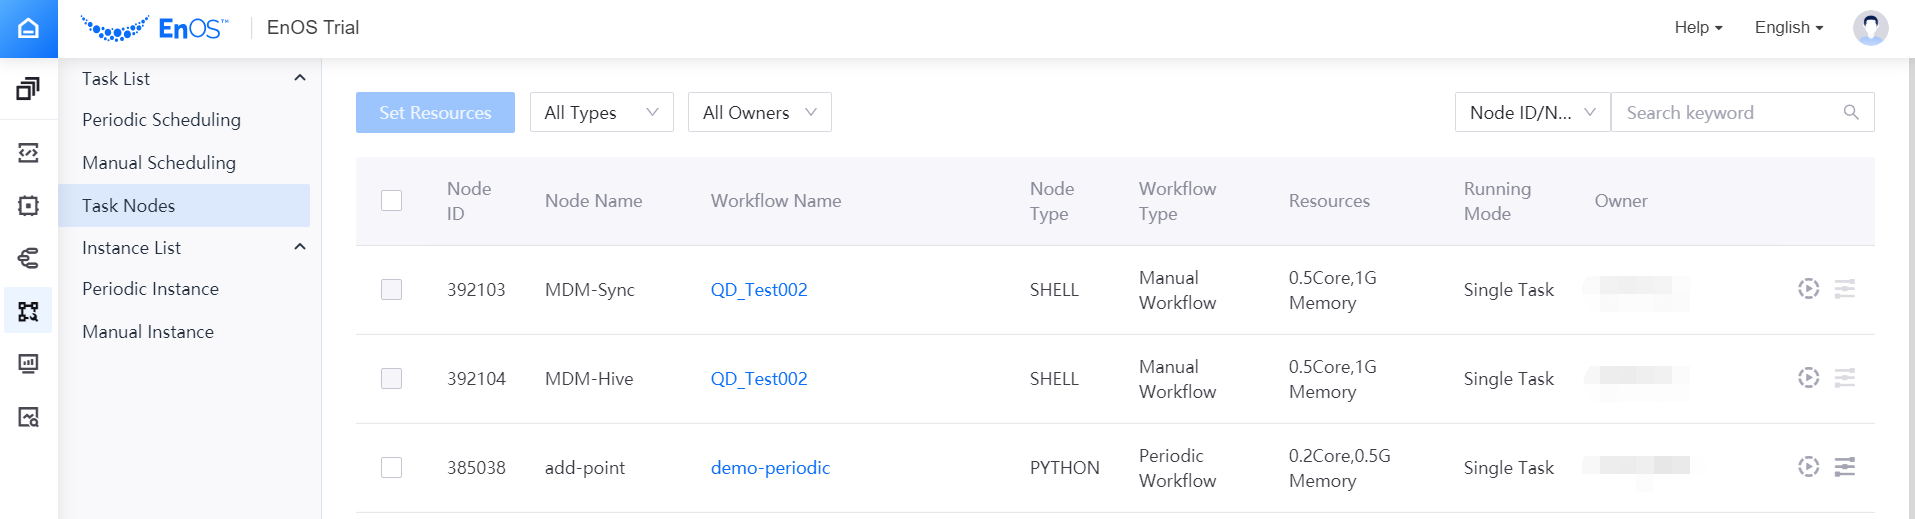
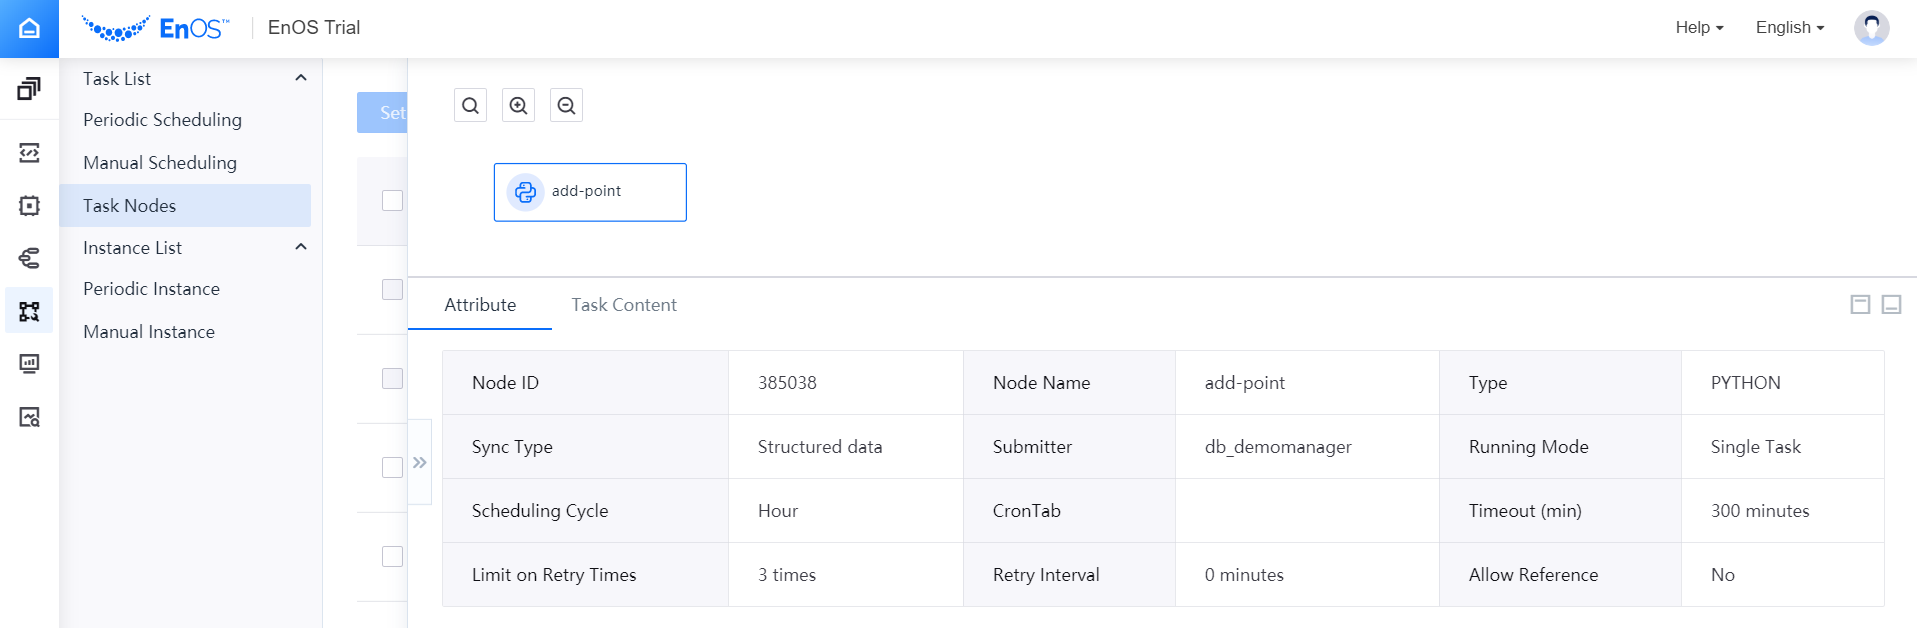
Click the workflow name in the task node list to open the task node detail page. Select the icon of a task node to view the attribute and content of the task node.
Monitoring Running Instances
In the task node table, click the Monitor Running Instances icon of the target task node to view the resource usage of the last 3 running instances of the task node.

Based on the actual resource usage of the task node instances, click the Configure Resources icon of the target task node to adjust the resource configuration for the task node.
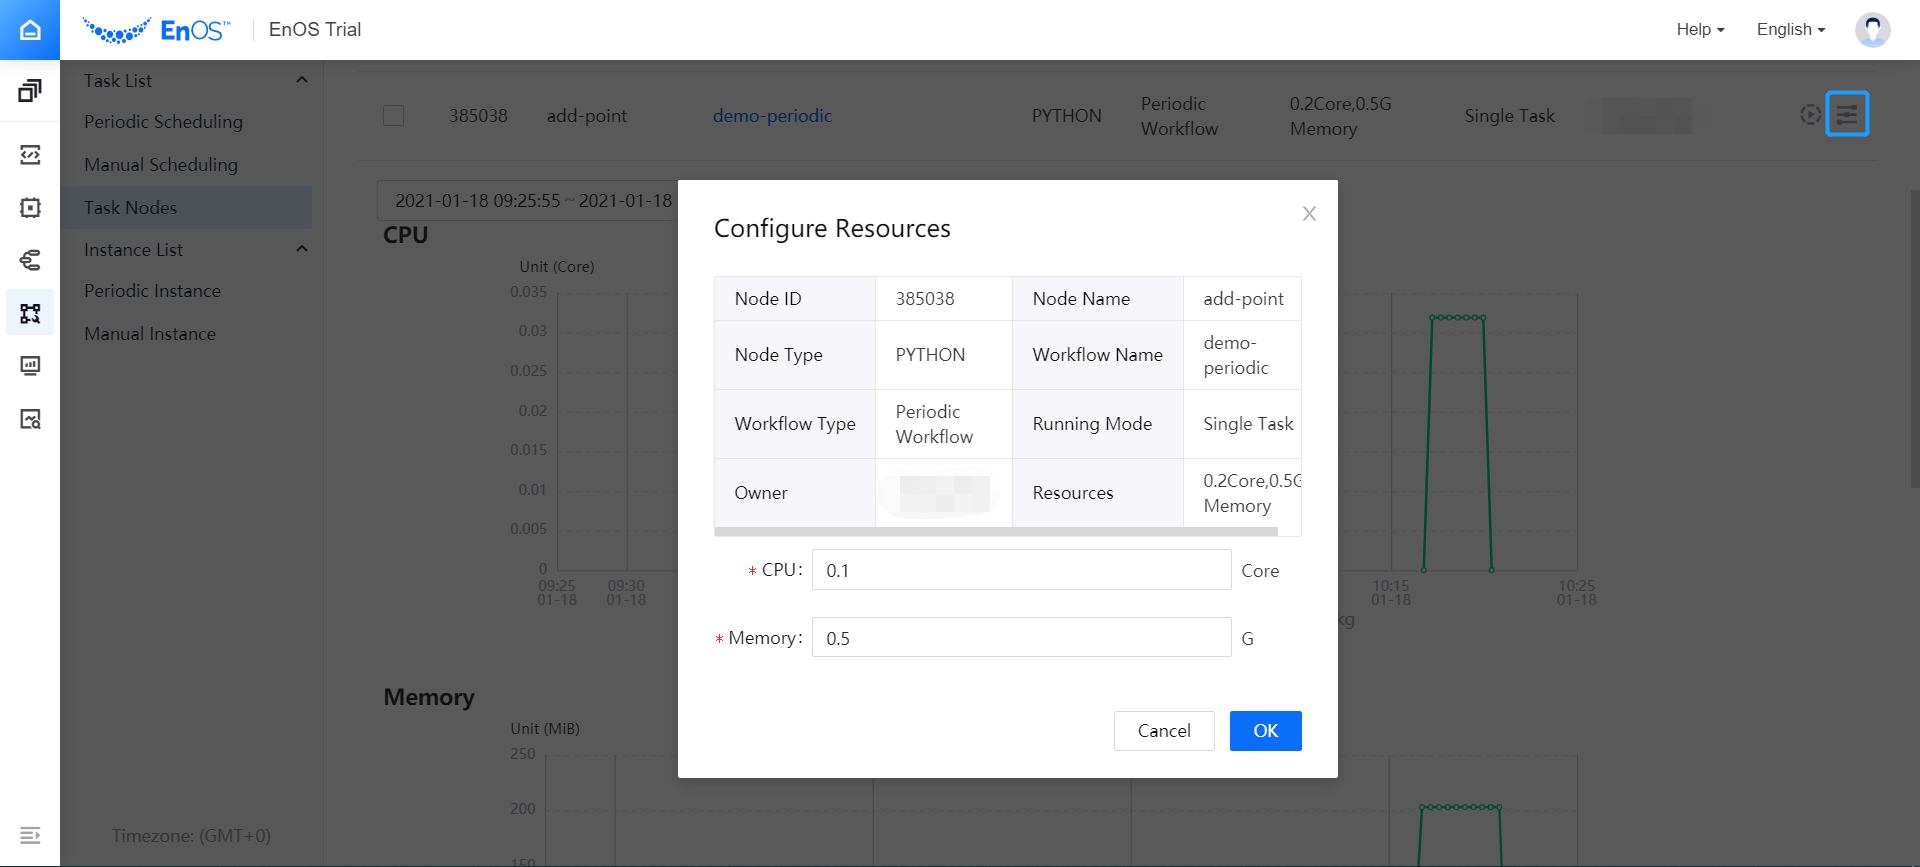
If you need to adjust the resource configuration of multiple task nodes, select the checkbox before the task nodes, and click the Set Resources button. Enter the CPU and memory configuration in the pop-up window.
